"The current anthropogenic global warming is unprecedented."
Sustainability
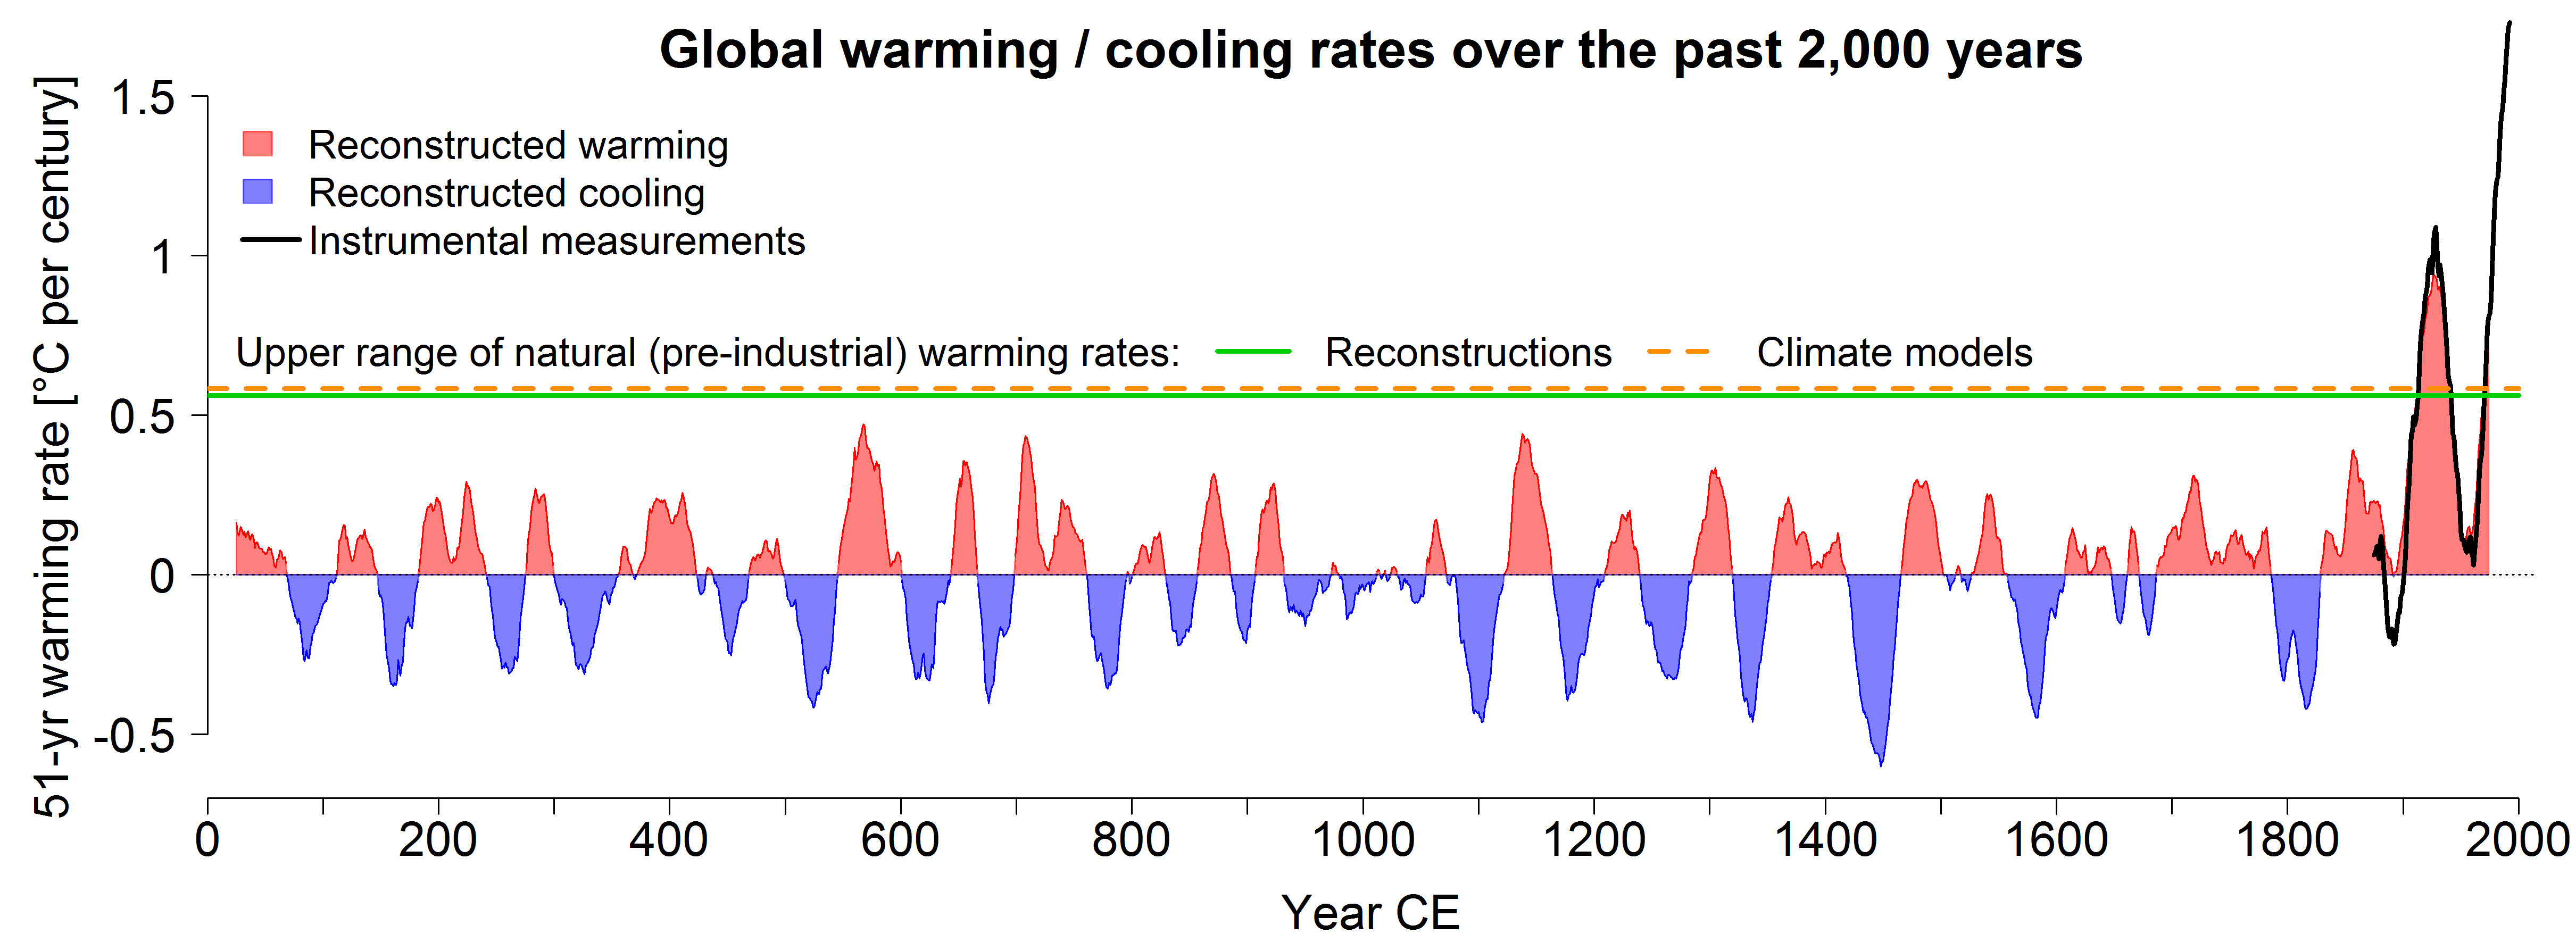
The climate is warming faster than it has in the last 2,000 years
In contrast to pre-industrial climate fluctuations, current, anthropogenic climate change is occurring across the whole world at the same time. In addition, the speed of global warming is higher than it has been in at least 2,000 years. That’s according to two studies from the University of Bern.
Climate fluctuations in the past varied from region to region
The authors of the study see the explanation for that as being that regional climates in pre-industrial times were primarily influenced by random fluctuations within the climate systems. External factors such as volcanic eruptions or solar activity, for example, were not intense enough to cause markedly warm or cold temperatures across the whole world simultaneously for decades, or even centuries.
Not only absolute temperature values were calculated, but also the probability of extremely hot or cold decades and centuries. The result: No globally coherent picture emerged during the periods being investigated. "The minimum and maximum temperatures were different in different areas," says Raphael Neukom. So thermal extremes across the world cannot be inferred from regional temperature phenomena like the oft-mentioned "Medieval Warm Period" in Europe and North America.
Did you know?
The database of the international research consortium PAGES (Past Global Changes) offers a comprehensive overview of climate data from the last 2,000 years. This includes tree rings, ice cores, lake sediments and corals. PAGES is based at the University of Bern.
The current warm period is happening across the world for the first time
However, global trends can be demonstrated for the recent past. Both studies show that the warmest period of the last 2,000 years was most likely in the twentieth century. On more than 98 percent of the Earth's surface. This shows – once again – that modern climate change cannot be explained by random fluctuations, but by anthropogenic emissions of CO2 and other greenhouse gases. What we didn’t know until now is that not only average global temperatures in the twentieth century are higher than ever before in at least 2,000 years, but also that a warming period is now affecting the whole planet at the same time for the first time. And the speed of global warming has never been as high as it is today.